Hello! Welcome to the second post of the earth.nullschool.net newsletter. I'm Cameron, creator of earth.nullschool.net.
Summary
Aurora visualization posted to YouTube
Coral reef "bleaching alert area" expanded to 5 levels
Change units (°C/°F, kmh/mph) by clicking on them. Also, your choice is now remembered between visits!
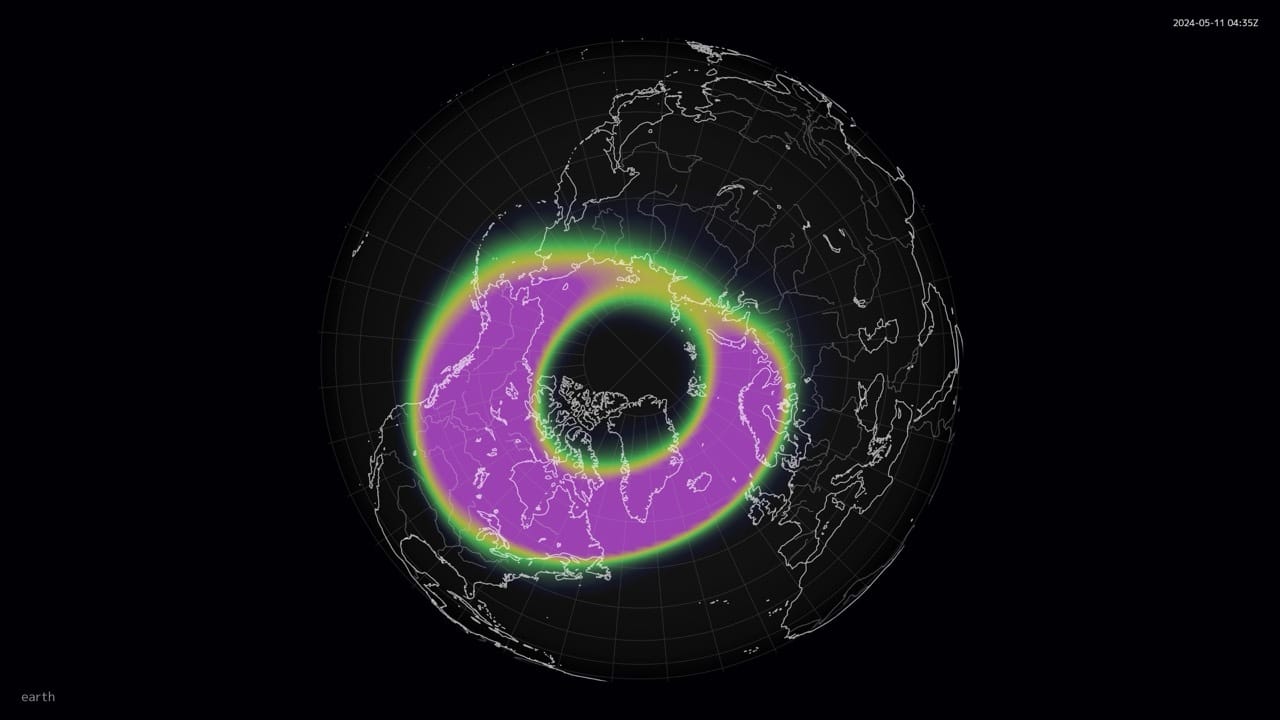
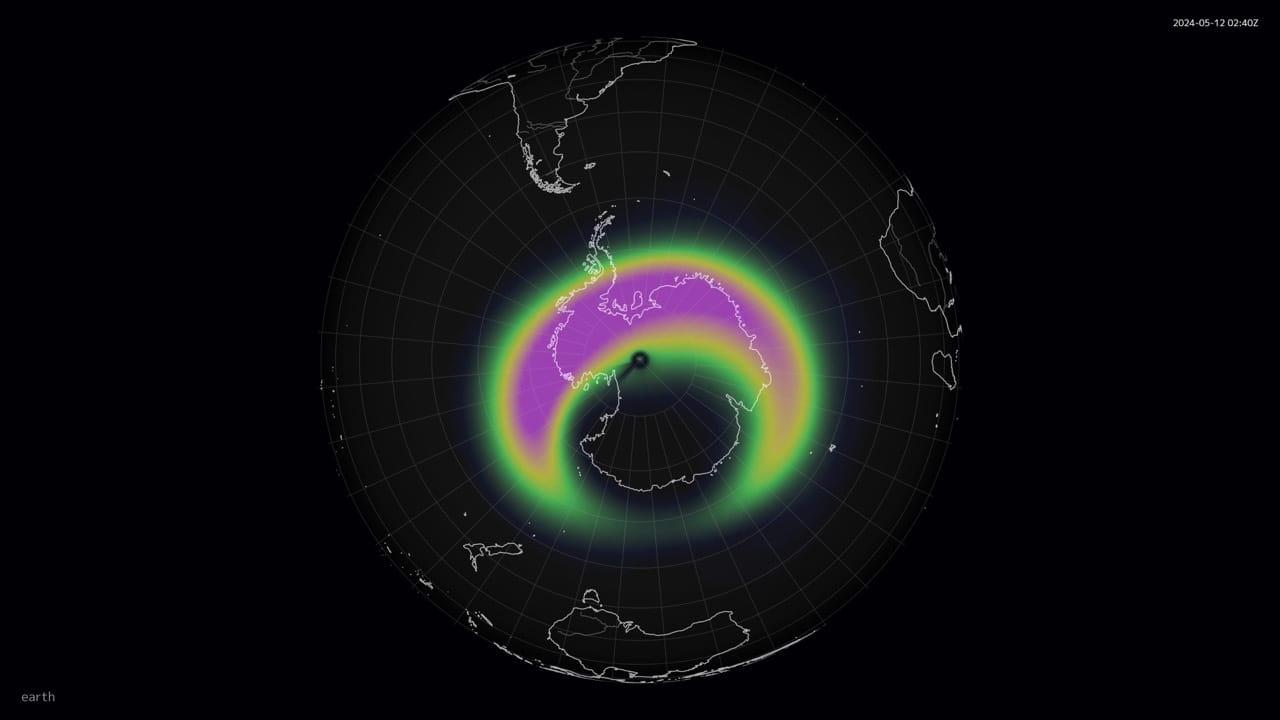
The Earth has been bombarded with solar particles over the past several days, causing the most intense geomagnetic storm since Oct 2003 (almost 21 years ago). The culprits are a set of coronal mass ejections emitted from a particularly active region on the Sun. They produced some very pretty aurorae visible at exceptionally low latitudes.
NOAA's Space Weather Prediction Center operates an aurora intensity product using the OVATION model, which has been available on earth.nullschool.net for several years. I quickly put together some time lapse animations of the solar storm event and uploaded them to YouTube:
The OVATION model shows % chance of visible aurora so isn't a picture of the aurora itself, but I think it provides a good sense of the intensity and shape of the event.
An update on coral reef bleaching:

before - after
NOAA's Coral Reef Watch team recently updated the "Bleaching Alert Area" product that tracks coral heat stress caused by ocean temperatures. (Corals turn white and die if the water gets too hot.) This update expands the number of alert levels from 2 to 5 to better account for the increasingly extreme levels of heat stress experienced by corals as the oceans get hotter.
Level 1: Risk of Reef-Wide Bleaching
Level 2: Risk of Reef-Wide Bleaching with Mortality of Heat-Sensitive Corals
Level 3: Risk of Multi-Species Mortality
Level 4: Risk of Severe, Multi-Species Mortality (> 50% of corals)
Level 5: Risk of Near Complete Mortality (> 80% of corals)
The timing couldn't be more prescient as NOAA announced a global coral bleaching event is currently underway, the 4th such event on record.
The updated Bleaching Alert Area product is now available on earth.nullschool.net as the "BAA" overlay, same as before. I kept the color palette consistent between updates by introducing darker shades of red for only the additional alert levels while leaving the original colors unchanged. The data has been backfilled to January, 2014. You can check it out here: link
Units. Those labels that describe what numbers mean. Degrees, watts, kilograms, inHg, µg/m³, etc. Over millennia, we humans have invented countless ways to measure and describe the same thing.
Thankfully, we've adopted the International System of Units as the global standard… for the most part. Some countries and industries still use their own set of measurements, like degrees Fahrenheit, inches, pounds, etc., in the USA, and knots and nautical miles for air and sea navigation use. To be accessible to the widest range of visitors, the site has supported multiple standards of measurements from day one.
However, based on feedback, I wouldn't say this feature was easy to find. (Something to improve in the near future.) For now, changing units is pretty simple once you know how. Just click or tap the units label:

click or tap on the label to change units
Each overlay has a set of supported units you can cycle through. Note that some layers support only one unit, like % Relative Humidity, so clicking the label has no effect.
As of a few weeks ago, the site now remembers which units you have most recently selected for each layer. When you reload the page or come back to it after some time, your preferred units are shown by default. This was a highly requested feature that I'm happy to announce is finally available.
As a side note, people often ask what the "degrees" next to the wind speed means. Not to be confused with temperature or geographic coordinates, this number is the direction of the wind.
By convention, wind direction is reported as "into the wind", the direction where the wind is blowing from. Imagine facing so the wind was blowing straight at you then reading that direction on a compass. If that wind was blowing directly from the North (towards the South), you would be facing North and the compass would read 0°.
(To be clear/pedantic, a compass points at magnetic north, but the degrees shown on the site are oriented on geographic north.)
The following illustration shows a more complex example. I've drawn a dashed line to make it easier to see the orientation of the wind inside the green circle. The wind blows from 135°, otherwise known as South-East:

wind direction in degrees
On the other hand, ocean currents have the opposite convention. They are reported as the direction the current is flowing to. Imagine facing so the current directly hits your back and then reading that direction on a compass. If that current was flowing directly from the North (towards the South), the compass would read 180°. Similarly, in the following diagram, the ocean current inside the green circle is flowing to the North-West, 315°:

ocean current direction in degrees
Hope this clarifies some points of confusion. That 315° number doesn’t mean temperature, otherwise we'd all be… very uncomfortable.
🌏🌍🌎


