- earth.nullschool.net news
- Posts
- New features: wet bulb and dew point temperatures
New features: wet bulb and dew point temperatures
Cameron Beccario
June 17, 2024
Hello! I'm Cameron, creator of earth.nullschool.net.
Two new data layers launched recently!
wet bulb temperature
dew point temperature
They require a bit of an explanation.
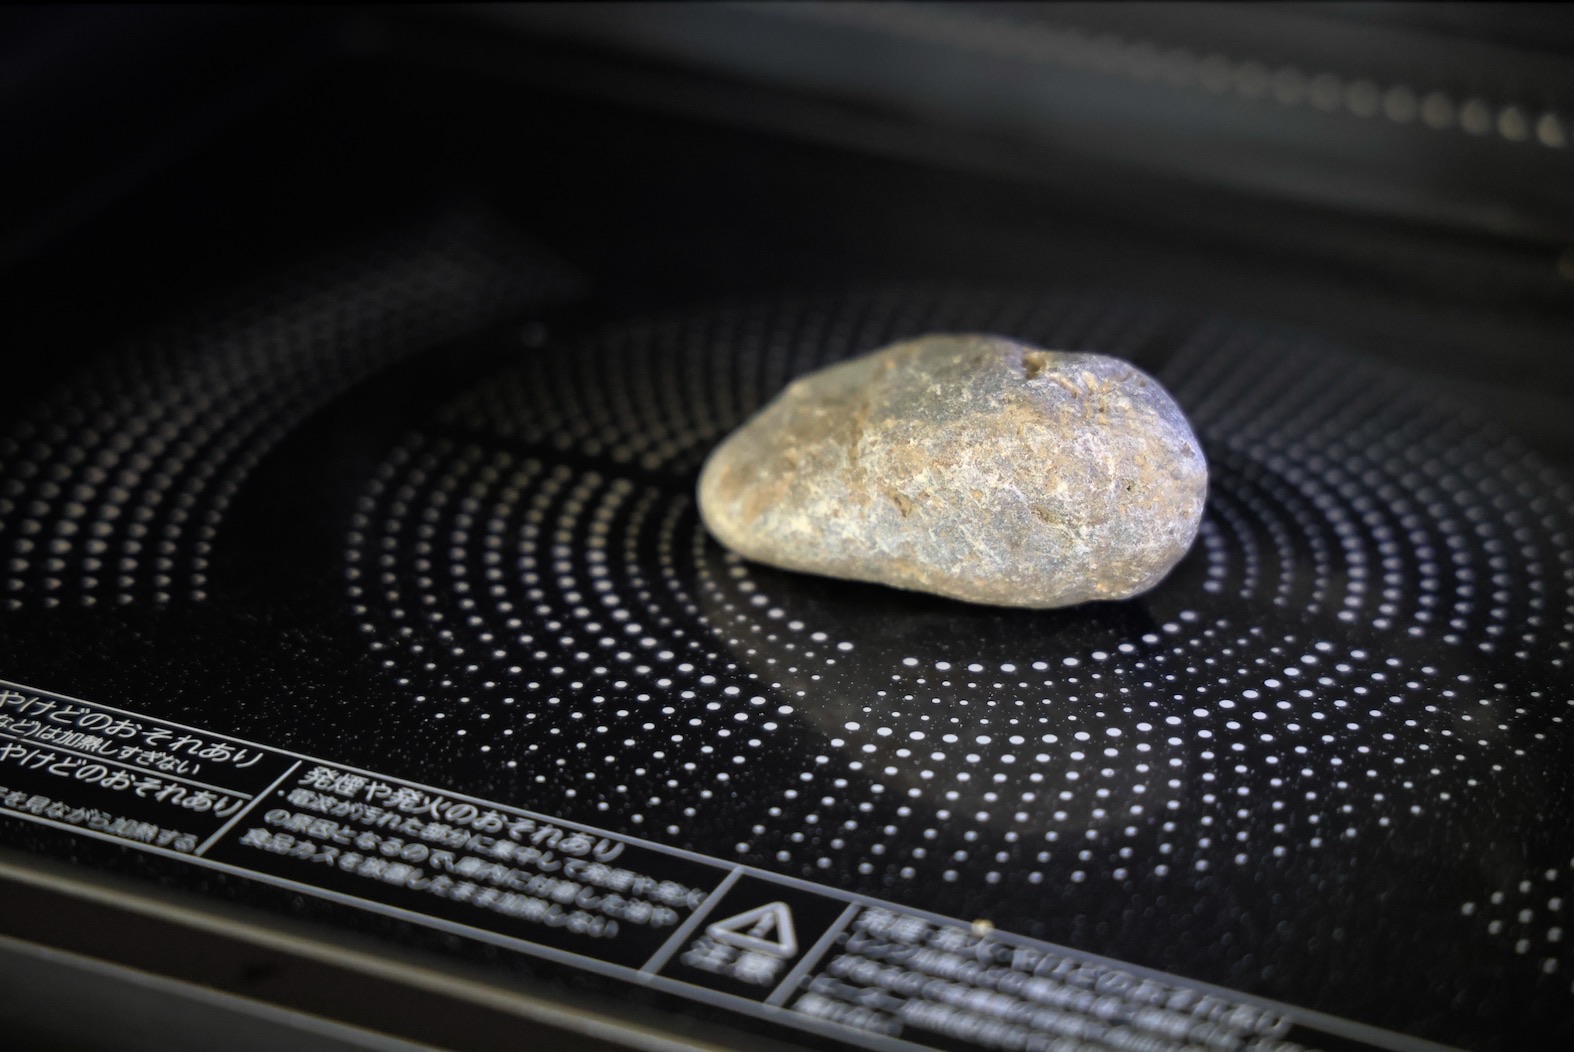
I put a rock in my oven just for this picture
Imagine a rock sitting in a warm oven. It's been there a while, so the rock and the oven are the same temperature. How can we cool the rock down without removing it or adjusting the oven settings?
Perhaps add a fan? Unfortunately, pointing a fan at the rock doesn't help. The stream of air is the same temperature as the rock, so the rock does not cool down.
Instead, we can make the rock wet! (No cheating; the water must be the same temperature as the rock.) As the water evaporates into the warm air, the rock cools down because the process of evaporation absorbs heat when converting liquid into vapor. The fan, assuming it hasn't yet melted, makes evaporation happen faster by continually replacing the moist air around the rock with dryer air.
But what if we have a steam oven? An oven that makes the air 100% humid–so humid evaporation can't occur! The wet rock does not cool down, even with a fan, because the oven already has the maximum amount of water vapor it can contain. No evaporation means no absorption of heat and no change in temperature.
This scenario demonstrates what is known as the wet bulb temperature: the temperature that can be reached through evaporation. Why "wet bulb"? Instead of a wet rock, we could wrap the heat sensing part of a thermometer (the bulb) with a wet cloth, point a fan at it, and observe the cooling effect. The temperature it reaches is determined by the cooling provided by evaporation, which is directly affected by the humidity of the air. The lower the humidity, the stronger the cooling effect of evaporation, and the lower the wet bulb temperature will get. The higher the humidity, the less cooling. Contrast this with the dry bulb temperature, which is our everyday notion of temperature (no wet cloth wrapped around the thermometer). The dry bulb temperature is not influenced by evaporation, so humidity has no effect.
This relationship between dry bulb temperature and humidity brings up an additional concept: dew point.

Here’s a box with some air.

The amount of water vapor the box can contain depends on the dry bulb temperature. When the box is warmer, it can contain more water vapor. When it is colder, it can contain less. (For pedants: "contain" means the vapor pressure of water diffused throughout the parcel, visualized here as boxes for simplicity.)

When the water vapor in the box is only half of what it could be, relative humidity (RH) is 50%. If we keep the amount of water vapor constant and chill the box until RH becomes 100%, we have reached the dew point temperature. This is the temperature where water vapor will start to condense out and form "dew".
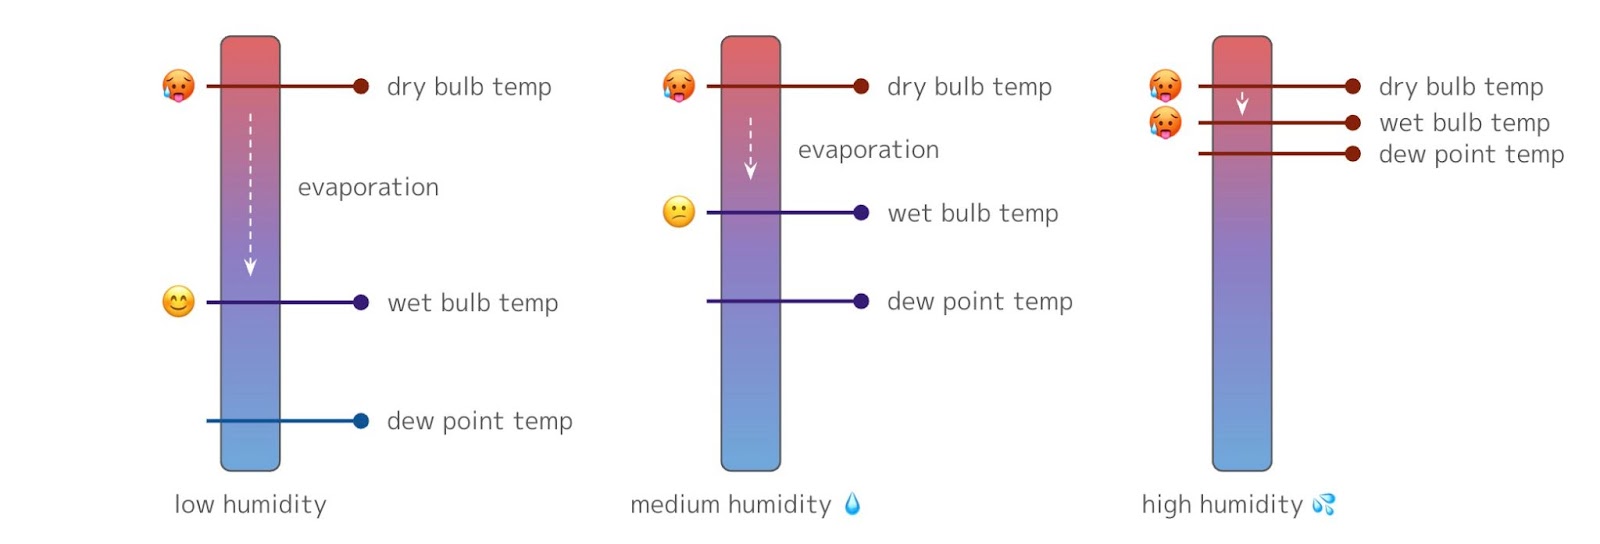
relationship between dry bulb, wet bulb, and dew point temps depending on humidity
These three temperatures, dry bulb temp, wet bulb temp, and dew point, tell us a lot about the state of the air. We can tell how hot it is, the relative humidity, the temperature at which condensation will occur, and how effective evaporation can be to cool off.
Wet bulb temp is always sandwiched somewhere between dry bulb temp and dew point. And when RH is 100%, all three temperatures are equal.
Wet bulb temp (WBT) is a useful measure of heat stress.
We sweat to cool down through evaporation, allowing us to survive in dry bulb temps that would otherwise be lethal. However, as humidity goes up and WBT increases, sweating becomes less and less effective, even when sitting in front of a fan. If the WBT gets too close to body temperature, no amount of sweat or air flow will help us lose heat. We develop heat stroke (hyperthermia), then die.
The widely accepted limit of survivability is a wet bulb temp of 35 °C (95 °F). Thankfully, wet bulb temps rarely get this high on Earth… for now. The worry is climate change will increase the chance of wet bulb temps reaching lethal levels. Not good!
Lower WBT doesn't necessarily mean conditions are safe or even comfortable. Variations between individuals, their level of exertion and hydration, amount of clothing, sunlight, etc., are factors that contribute to heat stress. WBT does not take these into account. Still, it's one of several useful measures to help us understand when conditions reach dangerous levels.
One additional thing to mention: as you read the news about heat waves, you might encounter the term “wet bulb globe temperature”, or WBGT. Despite the name, this concept is very different! I hope to cover the distinction in a future newsletter post.
WBT is not included in the GFS, so I wrote a program to compute it. This was much more complicated than expected because no known formula can directly compute WBT. After experimenting with several approaches, I settled on the iterative algorithm used by Brice and Hall in their "Weather Calculator", feeding in GFS variables inputs.
This graph helps to visualize the non-linear relationship between these values:

To read the graph, find the dry bulb temp and relative humidity intersection, then follow the curved line up to see the corresponding WBT. Be aware this graph is valid only for average sea level pressure. (If you're curious about other pressure levels, I've uploaded a video to YouTube that shows them.) Notice how low humidity causes the WBT to become fairly low even for very hot conditions. To emphasize an earlier point, I added some emojis to show that even when WBT is low, conditions can still be pretty miserable.
Wet bulb and dew point temps are now live on e.n.n, with data going back to June 1st, 2024. I also uploaded a time lapse animation of WBT to YouTube. This release debuts a new color palette I first saw used by NOAA nearly 10 years ago. I have always wanted to use it, and the introduction of WBT seemed like a good excuse.
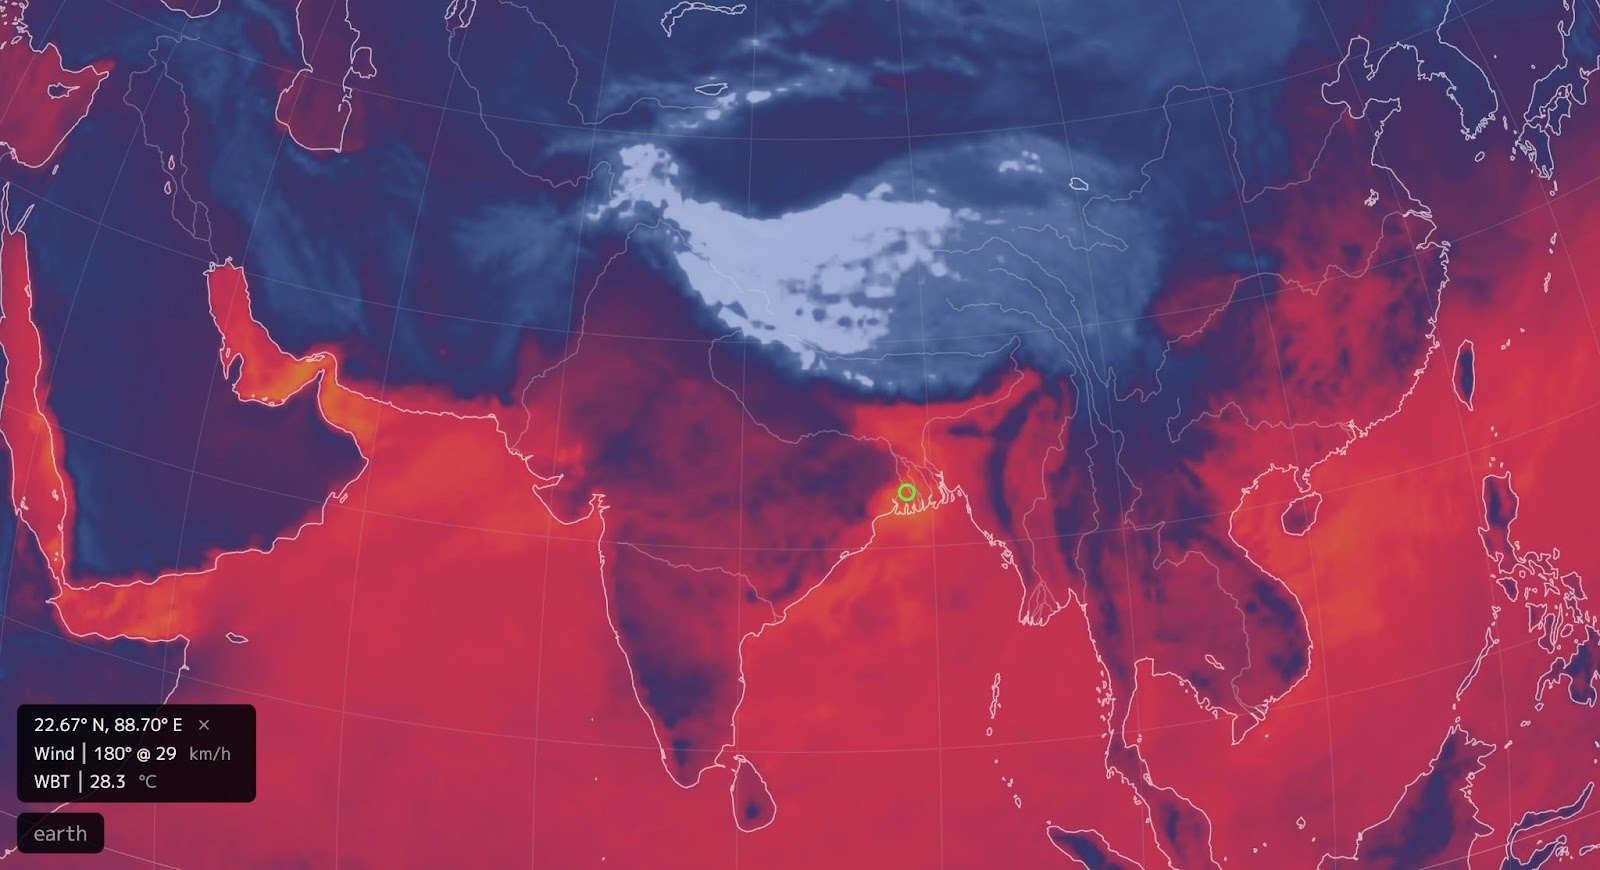
example of wet bulb temperatures over South Asia
The color palette gets progressively brighter as WBT increases to a dangerous level. Additionally, the palette has an intentionally rapid change to light blue around 0° C, which is a useful threshold for understanding precipitation type and the timing of strategies to protect against frost damage.
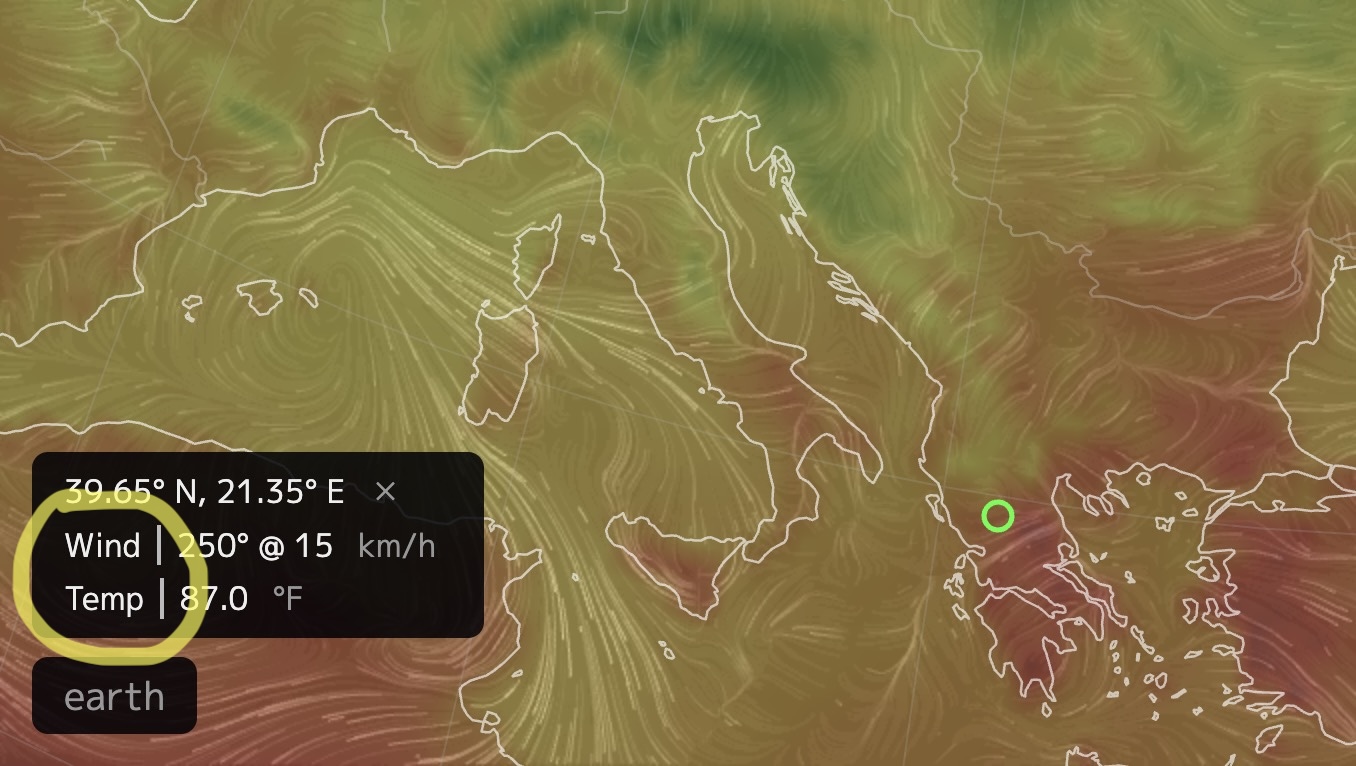
layer types shown in the spotlight panel
One other small improvement: the spotlight panel now shows the layer type next to the layer value. With the introduction of two additional temperatures, I found the lack of labels quite confusing, a sentiment shared in user feedback. This should hopefully reduce some confusion.
That’s all for now. As always, thanks for being a member of the e.n.n community. Even though I can’t reply to everything, I read all the feedback. Please let me know what you think of the new features and anything else you’d like to see.
🌏🌍🌎